
Tableau is a data visualization software that enables users to analyze, visualize, and share complex data insights in a simple and easy-to-understand format.
It provides a drag-and-drop interface that allows users to create interactive dashboards, reports, and charts to represent data from various sources, including Excel spreadsheets, databases, and cloud-based platforms like Salesforce and Google Analytics.
One of the key features of Tableau is its ability to connect to multiple data sources and transform raw data into meaningful insights.
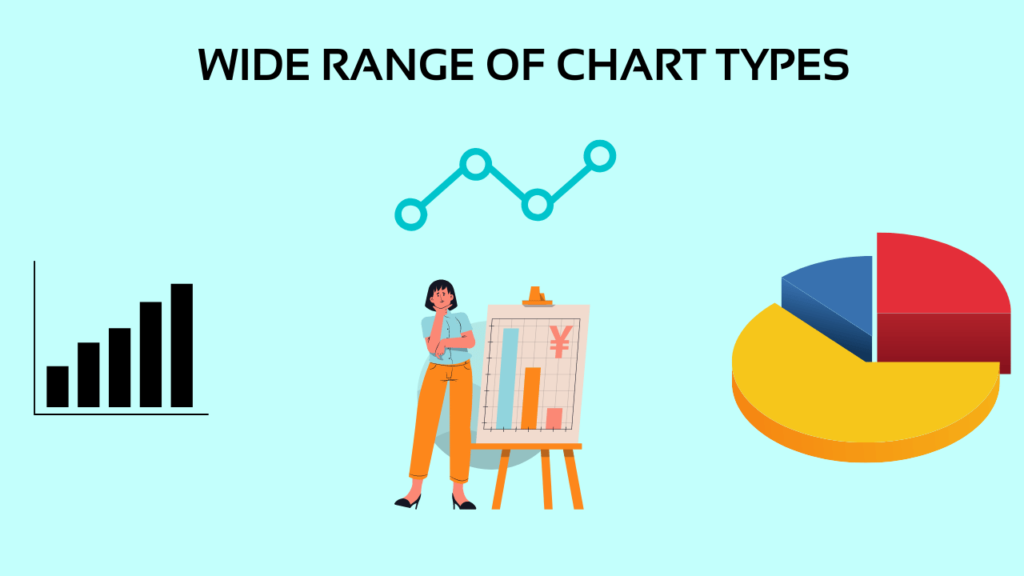
Once connected to the data, users can choose from a wide range of chart types, such as bar charts, line charts, scatter plots, and heat maps, to create visualizations that best represent the data.
Advanced charts like treemaps, packed bubbles, and bullet charts can also be created to convey complex information effectively.
Tableau’s data filtering feature enables users to filter data by date, region, or product category, among other options, helping them focus on specific aspects of the data.
Additionally, Tableau’s calculations and parameters allow users to perform more advanced analysis of their data, providing a deeper understanding of the insights.
Interactive dashboards are a major advantage of using Tableau.
Dashboards consist of multiple visualizations that allow users to explore the data and gain real-time insights by interacting with the visualizations.
For example, by clicking on data points or filters, users can update the other visualizations in the dashboard accordingly.
This feature enables users to ask and answer questions on the fly and uncover insights that may have gone unnoticed in a static report.
Tableau offers a wide range of sharing options, allowing users to share their visualizations and dashboards with others easily.
Users can publish their visualizations to Tableau Server, which provides secure access to other users. Alternatively, users can embed their visualizations into web pages, blogs, or other applications using Tableau’s JavaScript API.
In conclusion, Tableau is an essential tool for data analysts and business intelligence professionals who want to explore, analyze, and visualize data from various sources.
With its powerful features, intuitive user interface, and interactive dashboards, Tableau is an excellent solution for anyone looking to gain insights from their data.
Also, check the Tableau mcq question